

Hey there! As a supplier of NCM battery cells, I often get asked about the discharge curve of these batteries. So, I thought I'd write this blog to break it down for you in simple terms.
First off, let's talk about what NCM battery cells are. NCM stands for Nickel-Cobalt-Manganese. These battery cells are super popular in a whole bunch of applications, from electric vehicles to portable electronics. They're known for their high energy density, good cycle life, and relatively low cost compared to some other battery chemistries.
Now, the discharge curve of an NCM battery cell is basically a graph that shows how the voltage of the battery changes as it discharges. In other words, it tells you how much power you can get out of the battery at different stages of its discharge.
The discharge curve of an NCM battery cell typically has three main regions: the constant voltage region, the transition region, and the end-of-discharge region.
Constant Voltage Region
At the beginning of the discharge process, the voltage of the NCM battery cell remains relatively constant. This is because the chemical reactions inside the battery are happening at a steady rate, and the battery is able to deliver a consistent amount of power. During this region, the battery is operating at its peak efficiency, and you can expect to get the most power out of it.
Transition Region
As the battery continues to discharge, the voltage starts to drop more rapidly. This is the transition region, and it's where the battery's performance starts to decline. The chemical reactions inside the battery are slowing down, and the battery is no longer able to deliver as much power as it did in the constant voltage region.
End-of-Discharge Region
Finally, when the battery reaches the end of its discharge, the voltage drops off sharply. This is the end-of-discharge region, and it's a sign that the battery is almost out of power. At this point, it's important to stop using the battery and recharge it as soon as possible to avoid damaging it.
The shape of the discharge curve can vary depending on a few factors, such as the specific composition of the NCM battery cell, the temperature, and the rate of discharge. For example, if you discharge the battery at a higher rate, the voltage will drop more quickly, and the battery will reach the end-of-discharge region sooner.
So, why is the discharge curve of an NCM battery cell important? Well, understanding the discharge curve can help you optimize the performance of your battery-powered devices. By knowing how much power you can expect to get out of the battery at different stages of its discharge, you can make sure that your devices are operating at their peak efficiency.
For example, if you're using an NCM battery cell in an electric vehicle, you can use the discharge curve to plan your trips and make sure that you have enough power to reach your destination. You can also use the discharge curve to determine when it's time to recharge the battery to avoid running out of power on the road.
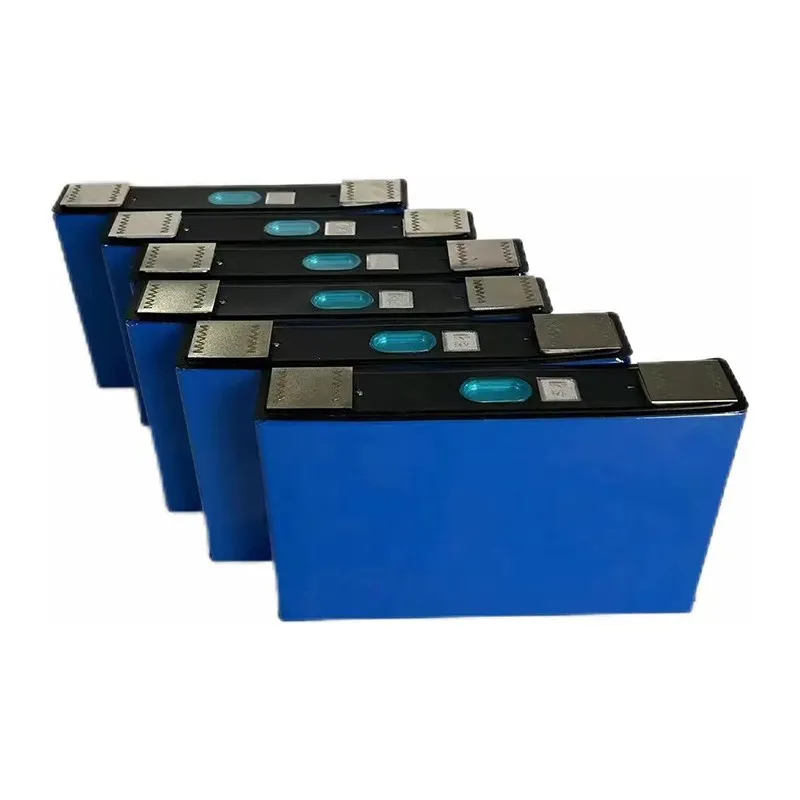
If you're in the market for NCM battery cells, we've got some great options for you. Check out our Prismatic 3.65V 55Ah NCM Lithium Ion Battery Cell, 3.67V 78Ah NCM Lithium Ion Battery, and Prismatic 3.73V 58Ah NCM Lithium Ion Battery Cell. These batteries are designed to provide reliable performance and long cycle life, and they're perfect for a wide range of applications.
If you're interested in learning more about our NCM battery cells or have any questions about the discharge curve, don't hesitate to get in touch with us. We'd love to help you find the right battery solution for your needs and start a procurement discussion.

References
- Linden, D., & Reddy, T. B. (2002). Handbook of Batteries. McGraw-Hill.
- Goodenough, J. B., & Kim, Y. (2010). Challenges for rechargeable Li batteries. Chemical Society Reviews, 39(11), 4366-4376.